BLAST Tutorial
The BLAST resources at the i5k Workspace@NAL have been completely re-engineered to provide support for many new features. Major new features include integration of the new suite of BLAST+ programs, a completely redesigned user interface that incorporates intelligent option selection, a queuing system to process requests, and a multi-panel result viewing page that allows for many different ways to view and filter the BLAST results.
In this tutorial, we explain some of the features of the BLAST site.
To begin, navigate to the BLAST site via the 'Tools -> Blast' menu bar, or go directly to http://i5k.nal.usda.gov/blast/.
Under the 'Organisms' menu, select one or several organisms that you would like to search against. Then, select which database should be searched. Available databases include genome assemblies, or transcript or protein sequences predicted from the genome. Only one residue type may be selected at a time - for example, both the genome assembly and transcripts can be searched simultaneously, but transcripts and proteins must be searched against separately.
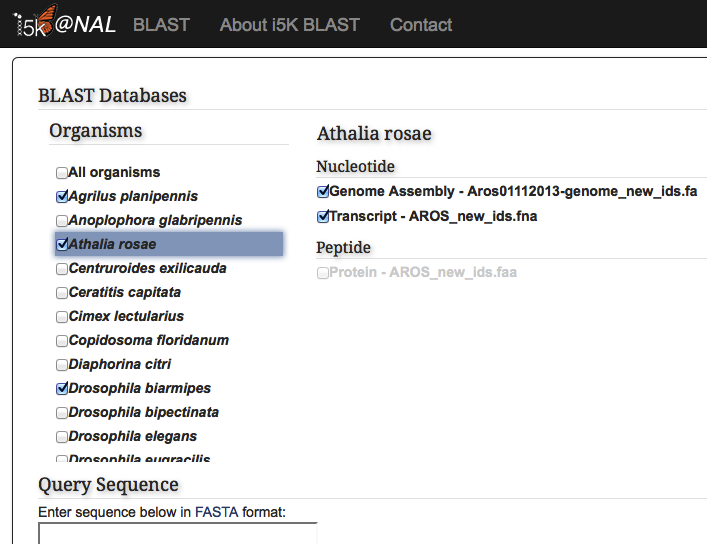
Paste your query sequence into the 'Query Sequence' field, or load it from disk. The BLAST programs that are not available for your combination of database and query will be greyed out.
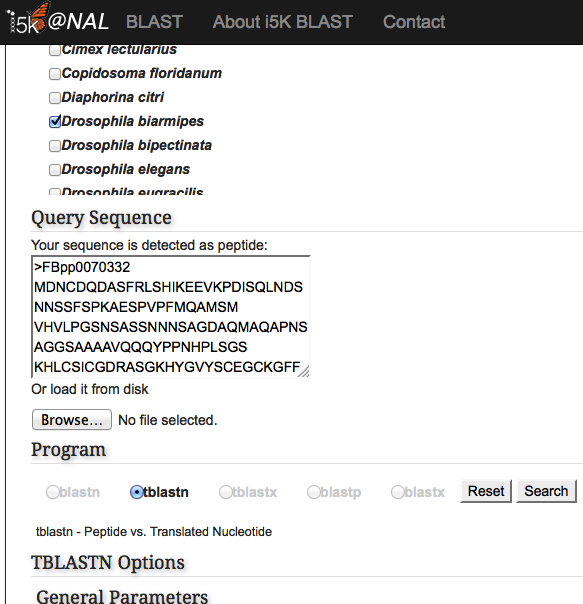
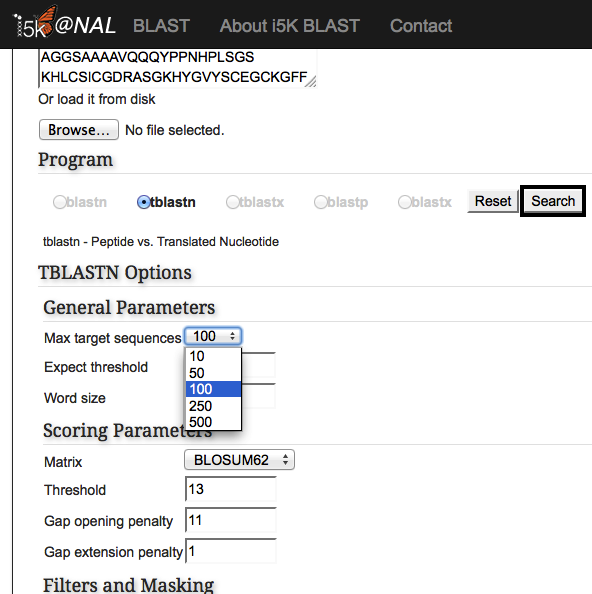
Once the correct BLAST program is selected, additional BLAST options may also be modified. Hit the 'Search' button when finished.
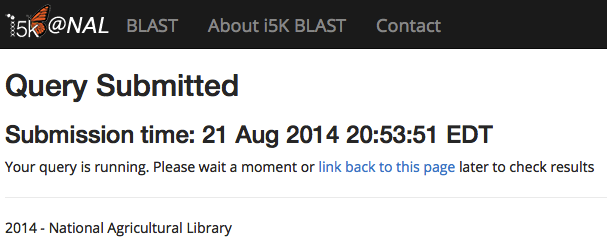
A page will display indicating that your query is running. You can store the indicated query link if you wish to come back to your BLAST results at a later time. Results are stored for one week.
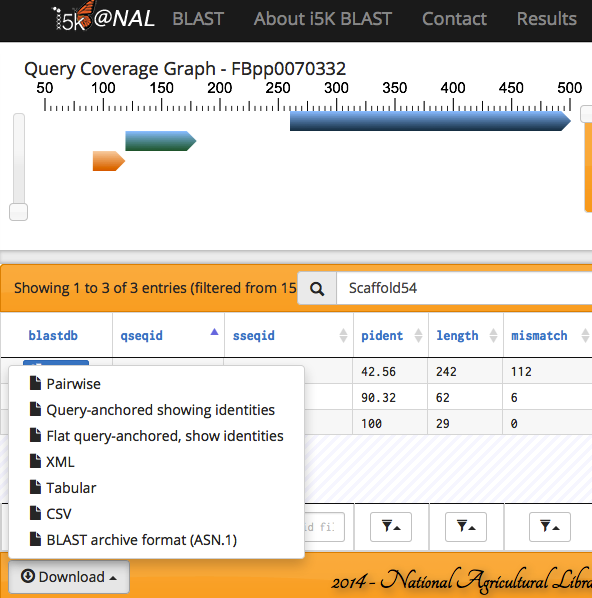
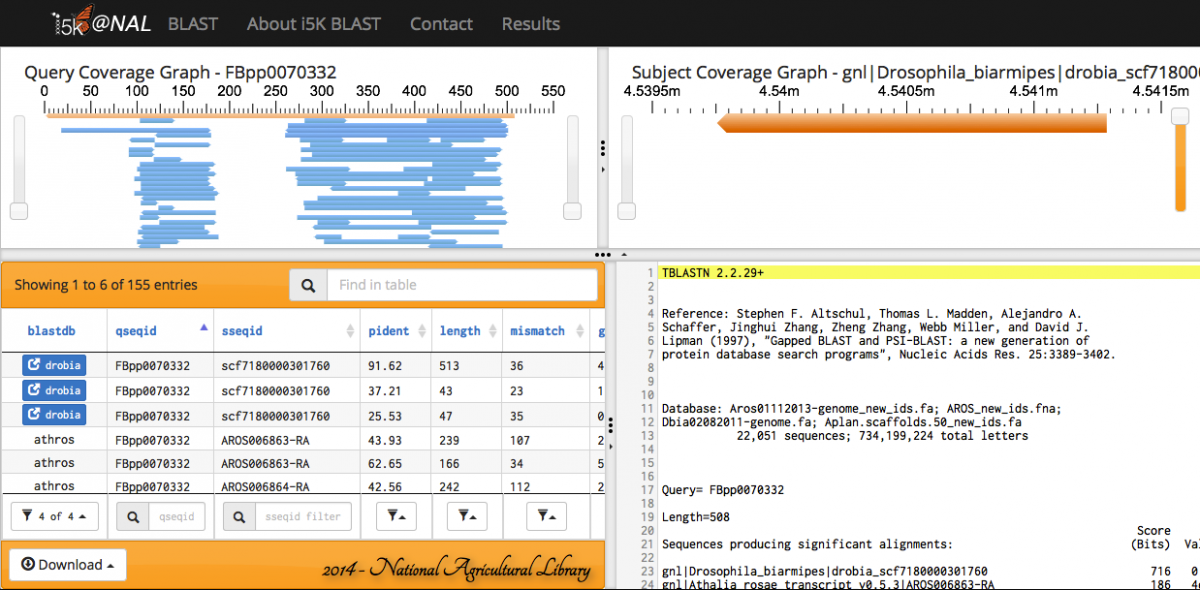
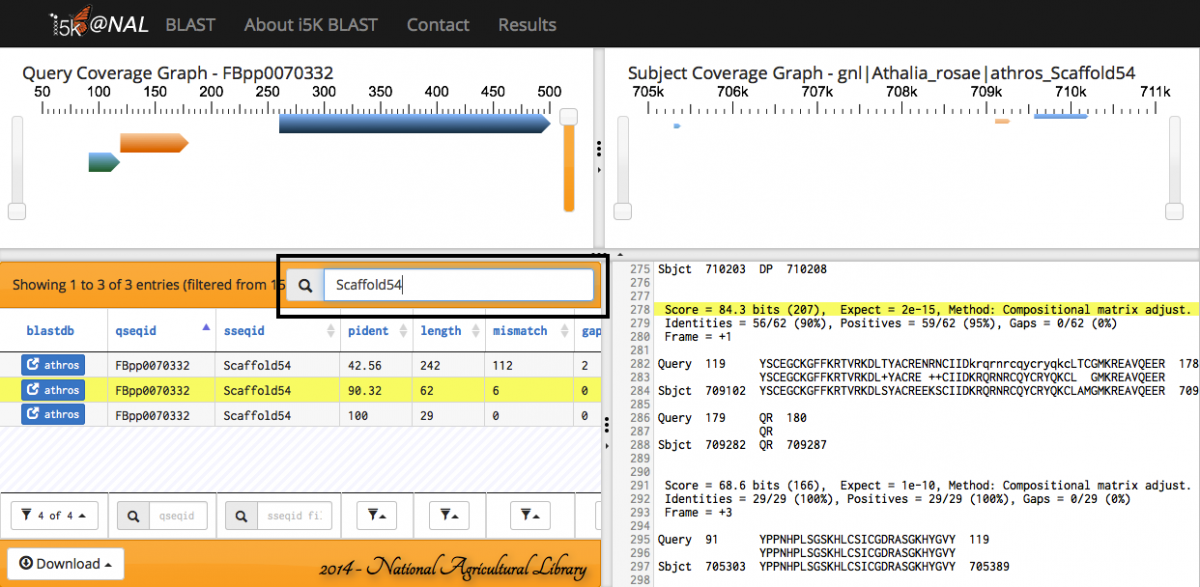
When the BLAST program has finished, your results will be displayed. Query and subject coverage graphs are displayed on the top left and right of the results panel, respectively. A tabular view of the results is on the bottom left, and raw text output on the bottom right.
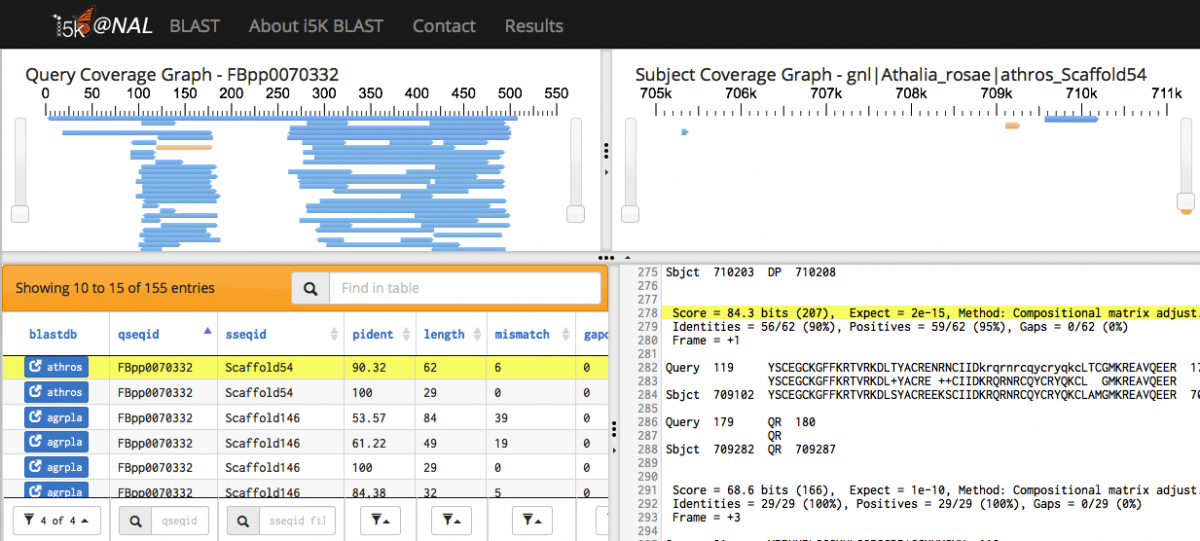
The feature heights on the query and subject coverage graphs can be modified using the right scroll bar.
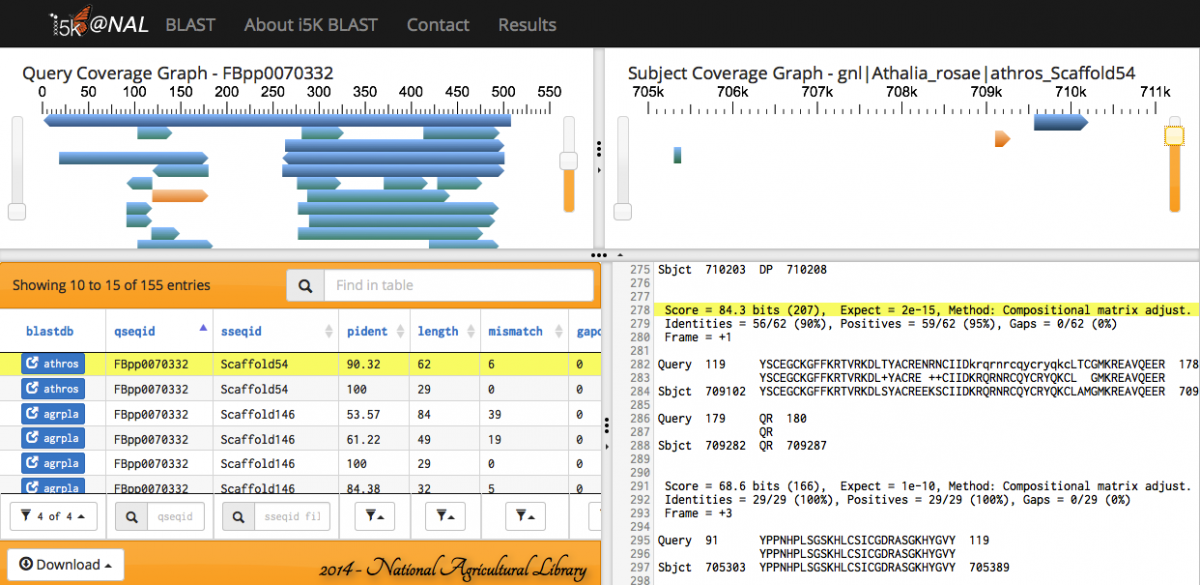
Scrolling over individual HSPs in any of the four panels will highlight the HSP across all panels - orange in the query and subject coverage graphs, and yellow in the results table and raw text output.
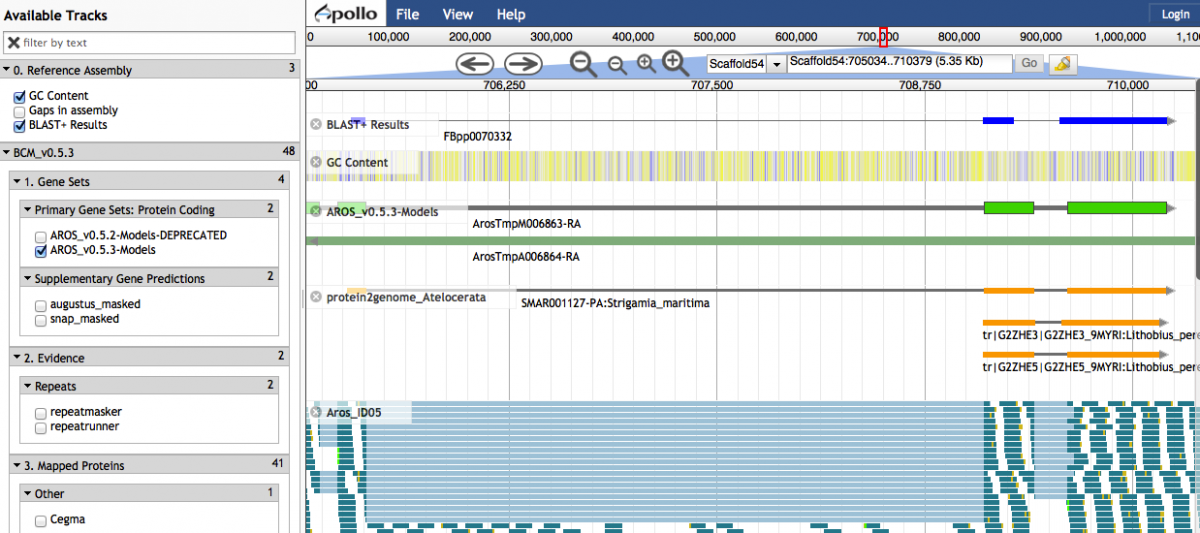
Clicking on a link-out icon under the 'blastdb' column in the Results table will open up a window in JBrowse. The HSP is displayed in the 'BLAST+ Results' track. Contiguous HSPs are grouped together into a single glyph if they have an identical query sequence, subject sequence, strand direction and an overlap length less than 6 between neighbouring HSPs under the same match.
Any of the fields in the Results table can be filtered.
The results can also be exported in various formats.